What Is a Good ROAS? Benchmarks by Business Type
One of the most common questions in advertising is simple: is my ROAS actually good. The honest answer is that there is no single good ROAS number for every business. What counts as strong performance depends on your profit margin, industry, and cost structure. This article breaks down realistic ROAS benchmarks across different business types, explains why the number shifts so much, and shows you how to find the right target for your own business.
What Is ROAS?
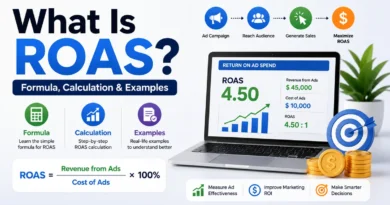
ROAS stands for Return on Ad Spend. It measures how much revenue your ads generate compared to how much you spent on them. The formula is:
ROAS = Revenue from Ads / Ad Spend
A ROAS of 4x means you earned four rupees in revenue for every rupee spent on ads. On its own, this number means very little without context, which is why benchmarks matter.
Why There Is No Universal Good ROAS
A 3x ROAS might be extremely profitable for a software business with high margins, but it could be a loss for a physical product business with high shipping and manufacturing costs. Since ROAS does not account for product cost or overhead, the same number can mean completely different things depending on your profit margin. This is why benchmarks always need to be looked at alongside your own cost structure, not treated as fixed rules.
ROAS Benchmarks by Business Type
The ranges below are general reference points based on common industry patterns. Your actual target should always be checked against your own break even ROAS.
Ecommerce and Physical Products
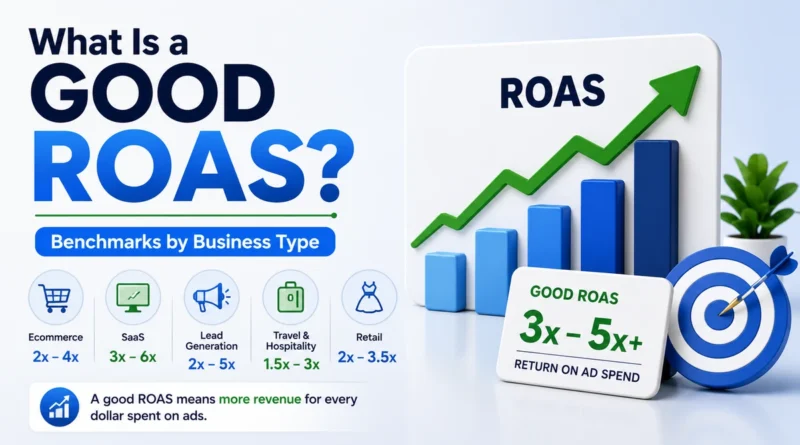
Most ecommerce businesses aim for a ROAS between 3x and 5x. Since physical products involve manufacturing, packaging, and shipping costs, a lower ROAS can quickly turn into a loss. Businesses selling low cost, high volume products often need a ROAS on the higher end of this range, sometimes 5x or more, to stay profitable after fulfillment costs.
Fashion and Apparel
Fashion and apparel brands often target 4x to 6x ROAS, since this category typically deals with higher return rates, seasonal markdowns, and thinner margins during sale periods.
Digital Products and Software
Businesses selling digital products, courses, or software subscriptions often remain profitable at a lower ROAS, sometimes 2x to 3x, because there is little to no product cost, shipping, or fulfillment involved.
Service Based Businesses
Service businesses, such as consulting, coaching, or agency services, can often accept a ROAS as low as 2x, since the cost of delivering the service is usually lower than a physical product, leaving more room for profit even at a lower revenue multiple.
High Ticket Products
Businesses selling high ticket items, like furniture, electronics, or luxury goods, sometimes work with a lower ROAS, around 2x to 3x, because each sale carries a much higher profit value even if fewer conversions happen.
Subscription and Recurring Revenue Businesses
For subscription businesses, ROAS is often measured differently, factoring in customer lifetime value rather than a single purchase. A first purchase ROAS of 1.5x to 2x can still be highly profitable if customers stay subscribed for several months.
Quick Reference Table
| Business Type | Typical ROAS Benchmark | Why |
|---|---|---|
| Ecommerce, physical products | 3x to 5x | Higher product and shipping costs |
| Fashion and apparel | 4x to 6x | Higher return rates and markdowns |
| Digital products, software | 2x to 3x | Low or no product cost |
| Service based businesses | 2x and above | Lower delivery cost |
| High ticket products | 2x to 3x | High profit per sale |
| Subscription businesses | 1.5x to 2x on first purchase | Profit builds over customer lifetime |
The Real Way to Know Your Good ROAS: Break Even ROAS
Instead of relying only on general benchmarks, the most accurate way to know your good ROAS is to calculate your break even ROAS, which is based on your own profit margin.
Break Even ROAS = 1 / Profit Margin
Example
If your profit margin is 25%, or 0.25:
Break Even ROAS = 1 / 0.25 = 4x
This means anything below 4x ROAS results in a loss, while anything above it generates real profit. This number is far more reliable than a generic industry benchmark, since it is based on your actual costs.
Factors That Change What a Good ROAS Looks Like
Profit Margin
Higher margin businesses can be profitable at a lower ROAS. Lower margin businesses need a much higher ROAS to reach the same result.
Customer Lifetime Value
If customers make repeat purchases or stay subscribed over time, a lower initial ROAS can still be highly profitable long term.
Business Goals
A campaign built for brand awareness may accept a lower ROAS than a campaign built purely to drive direct sales.
Ad Platform and Funnel Stage
Cold audience campaigns targeting new customers usually have a lower ROAS than retargeting campaigns aimed at people who already know the brand.
Seasonality
ROAS often shifts during high competition periods like festive sales or holiday seasons, when ad costs rise across the board.
Common Mistakes When Judging ROAS Benchmarks
Copying a benchmark without checking your own margin. A 4x ROAS might be excellent for one business and a loss for another.
Ignoring customer lifetime value. Judging ROAS only on the first purchase can undervalue subscription or repeat purchase businesses.
Comparing across unrelated industries. A software company’s ROAS and a clothing brand’s ROAS are not judged the same way.
Not separating cold and retargeting campaigns. Blending these together can make performance look worse or better than it actually is.
Final Takeaway
A good ROAS is not a fixed number, it depends on your profit margin, industry, and business model. As a general guide, most ecommerce businesses aim for 3x to 5x, while digital and service based businesses can remain profitable at a lower 2x to 3x. The most reliable approach is to calculate your own break even ROAS first, then use industry benchmarks only as a rough starting point, not a final answer.